
Statistics behind Machine Learning: Understand Simple Linear and Multiple Linear Regression

We all assume the AI will respond perfectly to our questions. But actually it does not. It just predicts. They find the pattern by using existing trained data and predict the next output. But how do they do that?
We all have this experience at times of watching the news on TV, 'Today in this city, we face heavy rain.' They don't confirm the event. They just predict. Now, many of them are confused. Why do you relate the climate prediction to this right?
The same concept applies here. Simply Statistics and Math are applied in both. In the old days, humans applied statistical methodologies. Now in modern day, by the machine but using the same concept, that's a only different.
So, without wasting much time, we will dive into it about "How the Statistics work behind ML and also take a look at the Python code."
Let's begin with the basics. What is machine learning?
They have many definitions. But simply learn the pattern by using past data and predict the future.
Then, for prediction, how do statistics help?
Let's see one by one. Begins with Linear Regression.
Linear Regression
Linear Regression is the starting point of ML. Regression means a method used to find the relationship between dependent and independent variables. The independent variables should be one or many, depending on the situation. Here in the Linear Regression it is one independent variable.
Again question was raised about "What is a Dependent and Independent variable?" in the mind, right.
The Independent variable means data that is used to predict the outcome for the dependent variable. Simply based on that, the dependent variable value changed accordingly. So, the dependent variable means it's an outcome for the independent variable.
But what is the purpose of the dependent and independent variables, man?
One other question hit in mind, right? I will answer for it. It's simple. By using the independent variable, we will find the relation and then predict the dependent variable. But how?
Here, the statistics help us. We will see that with an example.
Linear Regression Formula
In statistics, the equation is often written as
y = a + bx
where a is the intercept and b is the slope.
In machine learning, we commonly write it as
y = mx + c.
Here for the blog, I'm going to use y = mx + c. Why, because these are all we do to know the ML behind Statistics, right, so only.
Here, Y denotes the dependent variable, X denotes the independent variable, and m means slope.
The m helps to know how much y changes when x increases by 1.
Example:
If m = 2: x ↑ 1 → y ↑ 2
If m = −3: x ↑ 1 → y ↓ 3
So, slope is the rate of change. Which means the m. It is also called as co-efficient.
Then c denotes the intercept. It is a value of y when x = 0. A starting point of the line on the y-axis.
Example:
If c = 5: when x = 0 then y = 5
So, the intercept is the starting value of y. I hope the explanation is good. If yes, then we will move on to the example.
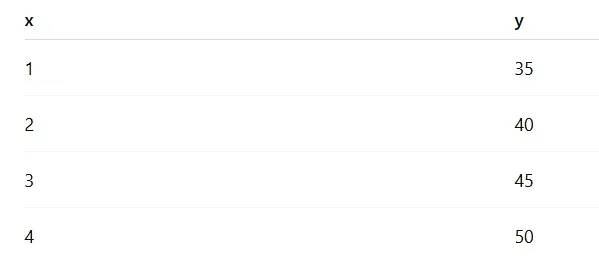
Linear Regression Example
Let's first calculate the slope:
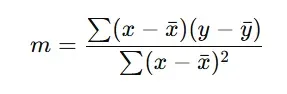
n = 4, sum of x = 10, sum of y = 170, Mean of x = 2.5, Mean of y = 42.5, sum of (x minus x-bar)(y minus y-bar) = 25, sum of (x minus x-bar) squared = 5
Finally, m = 5
Then calculate the intercept:
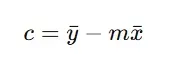
After applying the values, we got c = 30.
Then the equation in the form mx + c is 5x + 30.
Let's see how it predicts.
If X = 2:
y = 5(2) + 30 = 40
Likewise, it predicts output based on input. It's not magic. It's just a logic.
I hope you now understand how the statistics work behind the linear regression. But we're not going to use these statistics to train and predict the model, right?
We are going to use Python. So, let's see how it works behind it.
Our Python code
import numpy as np
from sklearn.linear_model import LinearRegression

x = [1,2,3,4]
y = [35,40,45,50]

x = np.array(x).reshape(-1,1)

lr = LinearRegression()
lr.fit(x,y)

m = lr.coef_[0]
c = lr.intercept_

print("="*100)
print("Linear Regression")
print("="*100)
print(f"Regression Coefficient is {m:5.2f}")
print(f"Intercept is {c:5.2f}")
print(f"Regression equation is y = {m:5.2f}x + {c:5.2f}")

y1 = lr.predict([[1]])[0]
print(f"Predicted value at x=1: {y1:5.2f}")
The first five lines are simple; it's about importing the libraries and data. Then,
x = np.array(x).reshape(-1,1)
It's used to convert the list into a NumPy array.
But why do we need to change the list into an array?
Because the machine learning algorithms accept arrays. Also, not as a single array. It converts that into a 2D array.
lr = LinearRegression()
Here, we create an object by calling the class name LinearRegression().
lr.fit(x,y)
Here we will access the method name fit and complete the overall process.
Many of them were shocked. But ya it's true. By calling the object and using this method. We will do the entire process, which we see above as a statistical step, like finding m and c.
m = lr.coef_[0]
c = lr.intercept_
Here, m, c denotes our formula had m, c.
We will store that value by calling the attributes.
lr.coef_[0] means it is in the list. By using the [0], we extract the value and save it here in the m variable.
print(f"Regression Coefficient is {m:5.2f}")
print(f"Intercept is {c:5.2f}")
print(f"Regression equation is y = {m:5.2f}x + {c:5.2f}")
Then print the value in the form of an equation.
y1 = lr.predict([[1]])[0]
Here, by using the method predict, we will predict y if x = 1.
y = 5(1) + 30 = 35
Then we got 35 as output.
It's the end of Simple Linear Regression, and the beginning of Multiple Linear Regression.
Multiple Linear Regression
The difference between simple and multiple linear regression is so simple. As we already know, in simple linear regression, there is one dependent and one independent variable. But in multiple linear regression, there are two or more independent variables and one dependent variable.
That's a single change between these two. Let's see these as code and formula, like we already see the simple linear regression.
Multiple Linear Regression Formula

Here, y is a dependent variable and two or more independent variables. In the single linear regression, it finds one coefficient or m value. Here, they find two or more m values based on the number of independent variables.
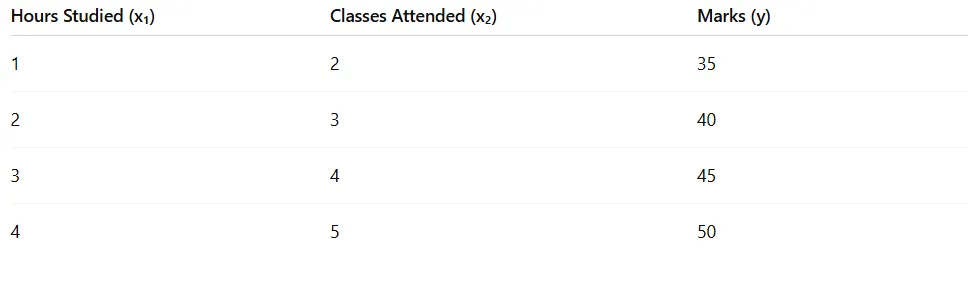
Now we will see the example,
We want to predict Marks (y) based on:
- Hours Studied (x1)
- Classes Attended (x2)
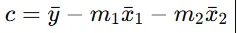
Then, after applying the same formula and finding each m value.
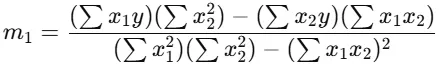
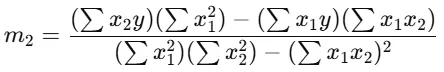
Same formula, with the addition of the independent values, and it is similar for finding c.
If Hours studied = 2, Classes attended = 3
Then,
y = 3(2) + 4(3) + 25
y = 3(2) + 4(3) + 25
y = 6 + 12 + 25
So predicted marks = 43
Now let's see how it works on Python code.
import numpy as np
from sklearn.linear_model import LinearRegression

# Input data
X = [
    [1, 2],
    [2, 3],
    [3, 4],
    [4, 5]
]

y = [35, 40, 45, 50]

# Convert to numpy array
X = np.array(X)
y = np.array(y)

# Create model
lr = LinearRegression()

# Train the model
lr.fit(X, y)

# Get coefficients and intercept
m1, m2 = lr.coef_
c = lr.intercept_

print("="*60)
print("Multiple Linear Regression")
print("="*60)
print(f"Coefficient for x1 (Hours): {m1:.2f}")
print(f"Coefficient for x2 (Classes): {m2:.2f}")
print(f"Intercept: {c:.2f}")
print(f"Regression Equation: y = {m1:.2f}x1 + {m2:.2f}x2 + {c:.2f}")

# Prediction
y_pred = lr.predict([[2, 3]])[0]
print(f"Predicted value for x1=2, x2=3: {y_pred:.2f}")
The same works are going on behind. But find multiple m values and a c value. Then we got the output as 43.
Finally, we reach the end of today's blog. I hope it is insightful. We will see you on the next blog about Polynomial Regression, Ridge and Lasso Regression, and others. See you there, guys.